|
Research Interests & Methods
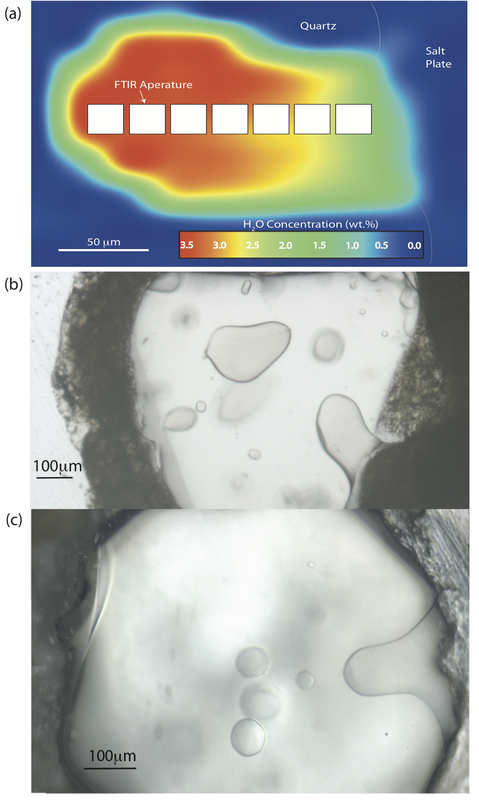
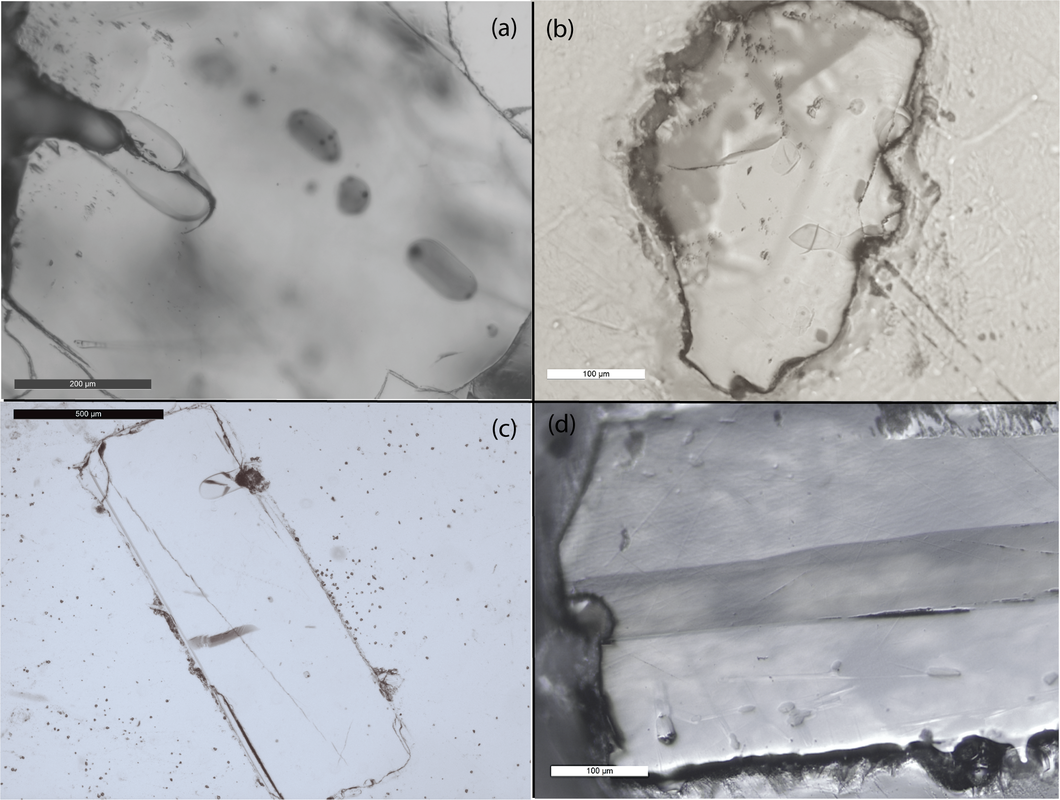
My research focuses on reconstructing the magmatic storage conditions and decompression history prior to an eruption in order to infer the mechanisms and events that trigger their explosive behavior. To do this, I combine detailed field sampling with volatile (H2O, CO2, S, F, Cl), major and trace element chemistry from melt inclusions and reentrants (unsealed inclusions; Fig. 1). Recently we have been exploiting the quick timescale of H diffusion through host grains (most notably quartz and olivine) to gain information on eruption timescales. Additionally, gradients of H2O and CO2 form in reentrants during ascent due to changing pressure conditions. Modeling these diffusion-driven gradients allows for an estimation of final ascent rates. These coupled methods provide robust tools for reconstructing the decompression history and timescales prior to explosive eruptions. |
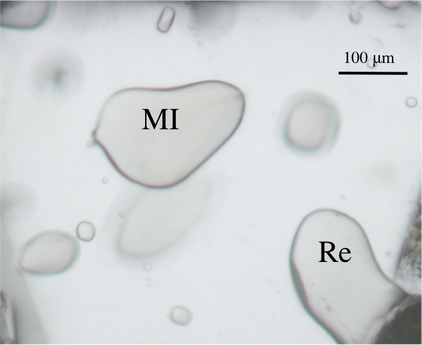
Fig. 1: My research focuses on using quartz-hosted melt inclusions and reentrants (inclusions in continuous diffusive contact with the surrounding melt) to measure major, trace, and volatile concentrations which are then used to reconstruct magmatic storage conditions and the decompression history prior to eruption.
|
Ongoing Research Projects
Ascent Rate of Rhyolitic Magma at the Onset of Caldera-Forming Eruptions
The rate at which magma ascends has a strong influence on the manner in which it (eventually) erupts. Slower ascent allows degassing of volatiles from the magma, favoring a more effusive eruption, whereas fast decompression fosters volatile retention and consequently results in more explosive behavior. Determining the rates at which magma ascends, and how those rates evolve over the course of an eruption, is thus important for understanding eruptive activity and improving monitoring and response for specific volcanoes. Furthermore, the ability to determine ascent rates through the use of erupted materials permits reconstruction of the progression of activity from individual eruptions, including historic events.
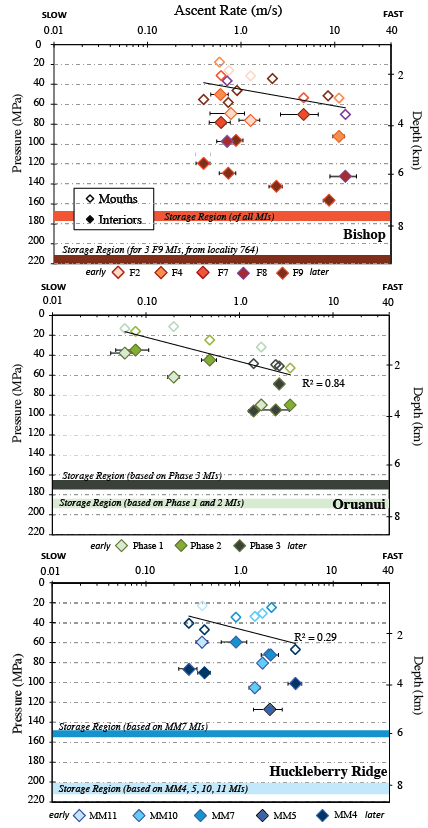
Here we use concentration profiles for H2O and CO2 determined by Fourier transform infrared spectroscopy for 38 reentrants in quartz and present best-fit diffusion profiles calculated using a decompression model for 31 of them. We focus on samples from the fall deposits of three rhyolitic supereruptions for which extensive fieldwork has been previously conducted, providing a solid framework for integrating calculated ascent rates with inferred eruption dynamics. Our study is motivated by a desire to understand: (1) whether decompression rates increase withincreases in eruption intensity inferred from field studies; (2) how ascent rates evolve over the course of an eruption; and (3) whether ascent rates can be related to inferred vent geometry, in- cluding the shift into the caldera-forming stages of the eruptions. To read more about this topic and what we have learned, please check out our recently published paper: LINK
The rate at which magma ascends has a strong influence on the manner in which it (eventually) erupts. Slower ascent allows degassing of volatiles from the magma, favoring a more effusive eruption, whereas fast decompression fosters volatile retention and consequently results in more explosive behavior. Determining the rates at which magma ascends, and how those rates evolve over the course of an eruption, is thus important for understanding eruptive activity and improving monitoring and response for specific volcanoes. Furthermore, the ability to determine ascent rates through the use of erupted materials permits reconstruction of the progression of activity from individual eruptions, including historic events.
Here we use concentration profiles for H2O and CO2 determined by Fourier transform infrared spectroscopy for 38 reentrants in quartz and present best-fit diffusion profiles calculated using a decompression model for 31 of them. We focus on samples from the fall deposits of three rhyolitic supereruptions for which extensive fieldwork has been previously conducted, providing a solid framework for integrating calculated ascent rates with inferred eruption dynamics. Our study is motivated by a desire to understand: (1) whether decompression rates increase withincreases in eruption intensity inferred from field studies; (2) how ascent rates evolve over the course of an eruption; and (3) whether ascent rates can be related to inferred vent geometry, in- cluding the shift into the caldera-forming stages of the eruptions. To read more about this topic and what we have learned, please check out our recently published paper: LINK
|
|
|
The Bronze Age Eruption of Santorini Volcano- Directly comparing Decompression and Mass Discharge Rates
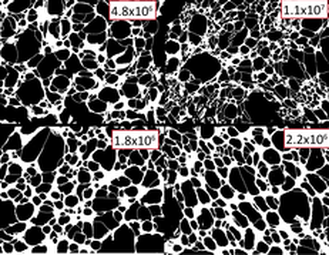
The aim of this project is to compare the decompression rates determined from volatile gradients preserved in reentrants with those determined using bubble number densities, both taken from the single pumice clasts. Additionally, we compare these decompression rates with mass discharge rate and plume height determined with detailed isopleth mapping. Through combination of these multiple independent methods we then investigate the time-evolution of eruptive intensity during the Plinian phase of the of the 3600 y BP Bronze-Age eruption of Santorini Volcano. Field work resulted in lithic data collected at 44 sites around the caldera rim, allowing us to interpret that the main Plinian phase began with a 13.5 ± 3 km high plume that grew to the peak height of 27 ± 5 km, before then decreasing to 17 ± 3 km. This final decrease in plume height coincides with the first appearance of pyroclastic surge deposits in the eruption sequence. Future work will integrate decompression rates from reentrants and bubble number densities into the discrete layers for which plume height (and thus mass discharge rate) was determined.
|
|
Finished Projects
Huckleberry Ridge Tuff (~2.1 Ma, 2,500 km3) The Huckleberry Ridge tuff (HRT) is the oldest and largest of the three caldera cycles that form the Yellowstone Volcanic Field (Christiansen 2001). We have focused our study on the initial fall deposit preserved at the base of member A, which contain evidence for reworking, reflecting episodic initial explosive activity associated with the voluminous ignimbrite-dominated HR eruptions (Christiansen 2001; Wilson 2009). These features raise the question: What allows an eruption to stop, once initiated, as well as what then allows for the transition into a caldera-forming event? To read more about this topic and what we have learned from this fall deposit, please check out our recently published paper: PDF. |
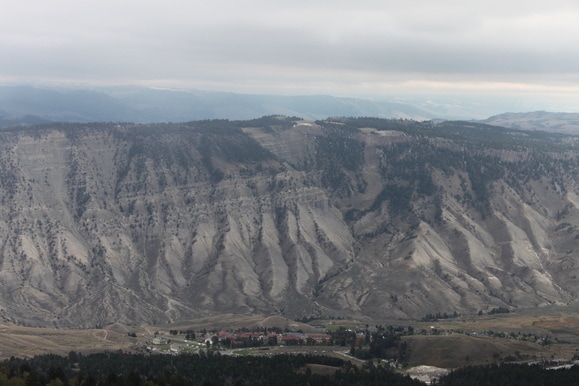
Fig. 2: Looking at Mt. Everts, sampling location of the thickest preserved fall deposit of the Huckleberry Ridge Tuff.
|
|
Bishop Tuff (767 ka, 600 km3)
The Bishop Tuff is the archetypical example of a large-volume, compositionally zoned magma chamber, where the entire eruption is thought to have occurred in a continuous fashion. This means that there are no inferred time breaks during the deposition of the initial fall deposit or in the transition to flow deposition, where the entire eruption is estimated to take ~6 days. Current work involves comparing ascent rates modeled from H2O and CO2 concentrational gradients preserved in reentrants (Fig. 1) to those measured from the Huckleberry Ridge and the Orunaui events, in order to determine if an ascent rate can be linked with the extent of overpressure within the system. We investigate these rates throughout the stratigraphy for all three eruptions to evaluate the evolution of conduit conditions as the eruption progresses. |
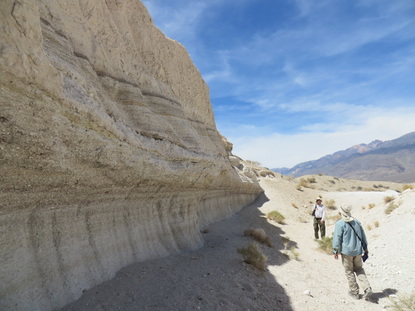
Fig. 3: Iconic location for the Bishop Tuff fall deposit. Shout out to my two fantastic Ph.D. advisors, Dr. Paul Wallace (main advisor, University of Oregon) and secondary advisor Dr. Colin Wilson (Victoria University, Wellington NZ)
|
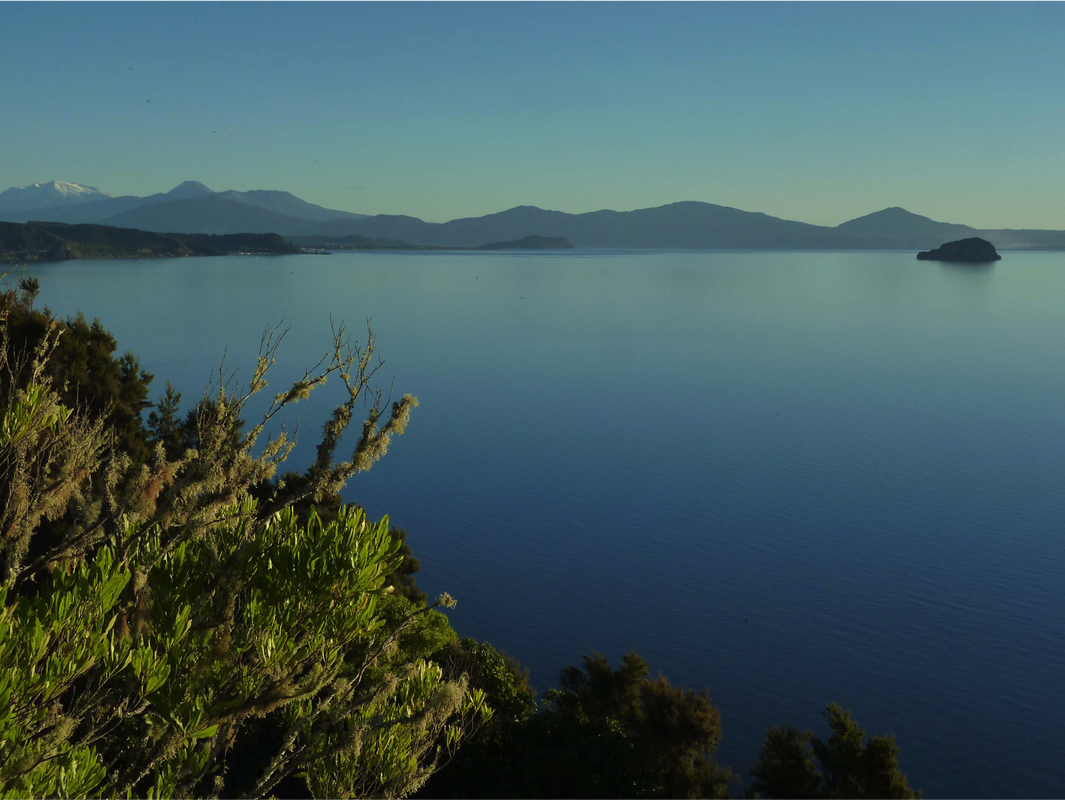
Fig. 4: Taupo Lake is the visual representation of the Taupo caldera from which the Oruanui supereruption originated.
|
Oruanui Supereruption (26.5 ka, 530 km3)
The Oruanui eruption is part of the Taupo Volcanic Zone, a back-arc extensional environment where the center of the rift is associated with one of the most productive rhyolitic centers today. The Oruanui is also the youngest supereruption on Earth. Unlike the continuous behavior observed in the Bishop Tuff eruption, and the subtle reworking in the very initial fall layers in the Huckleberry Ridge Tuff, the Oruanui deposits have been broken into 10 distinct phases, where time breaks are inferred between 5 of these phase transitions. The longest break is between Phase 1 and Phase 2, which due to the extent of reworking with the underlying paleosol, has been interpreted to represent a time break on the order of weeks to months. We apply the same diffusion methods as were used in the Huckleberry Ridge to address the timescales of ascent for the first three phases of this eruption. |
|
San Luis Complex: Petrology of Cebolla Creek Tuff
The San Juan Volcanic Field, located in the southern Rocky Mountain, Colorado, consists of ~30 large-volume ignimbrites, including the voluminous Fish Canyon Tuff. The Fish Canyon Tuff (FCT) represents one the largest volcanic eruptions on Earth, involving thousands of cubic kilometers of what is thought to represent remobilized granodioritic plutons erupted from very large calderas (Bachmann et al. 2002). The goals of the past decade have been to understand how such large bodies of nearly solidified magma become rapidly reheated and recharged with volatiles to make them eruptible. Although much of the focus has been on the FCT, there exist several other voluminous units that have yet to be fully explored. The San Luis Complex consists of three compositionally diverse ignimbrites including the Rat Creek, Cebolla Creek , and Nelson Mountain Tuffs. These units are unique as they represent some of the youngest units of the he San Juan Volcanic Field, emplaced geologically rapidly between 26.91 ± 0.02 and 26.87 ± 0.02 Ma. These dates suggest that these three units erupted within ~40,000 years of each other (Lipman 2007), providing a shorter recurrence rate for large explosive eruptions than has been previously documented (Lipman & McIntosh 2008). |
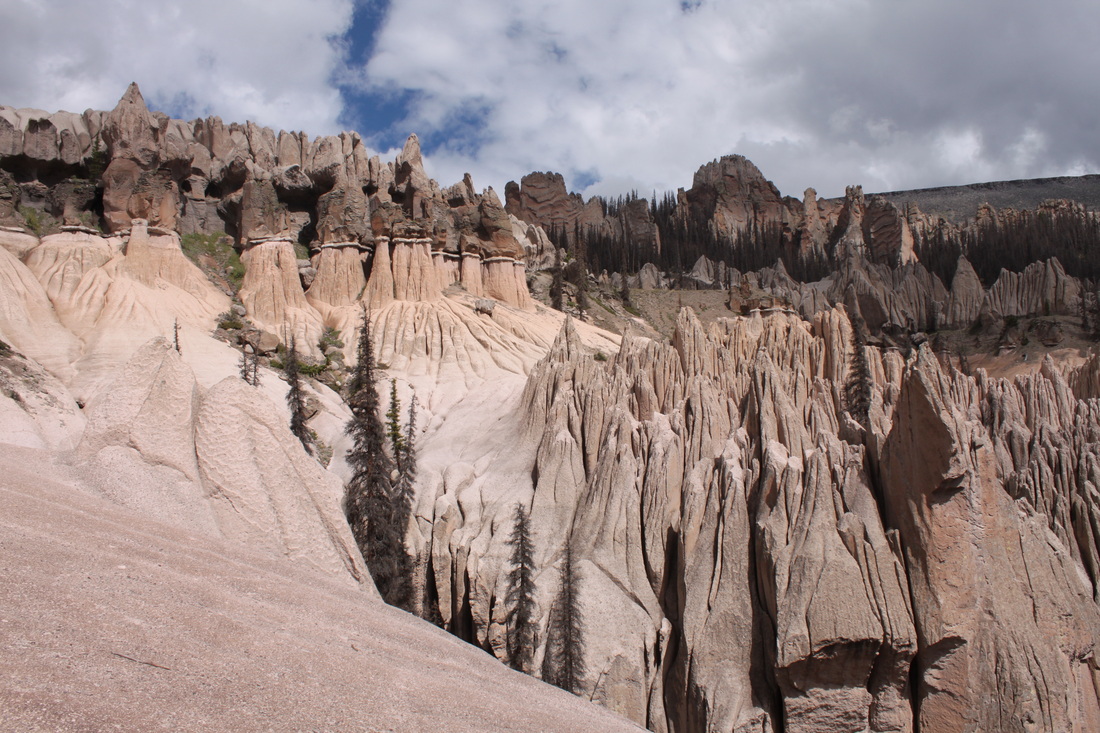
Fig. 5: Wheeler Geologic Monument, Colorado. Great location for a stratigraphic representation of the Rat Creek, Cebolla Creek, and Nelson Mountain Tuff.
Additionally, what makes the San Luis Complex intriguing, is the crystal-poor nature of the Rat Creek and Nelson Mountain Tuffs, sandwiching the crystal-rich Cebolla Creek Tuff. What processes produced and erupted such distinctly different units on such geologically rapid timescales?
|
Reheating Melt Inclusions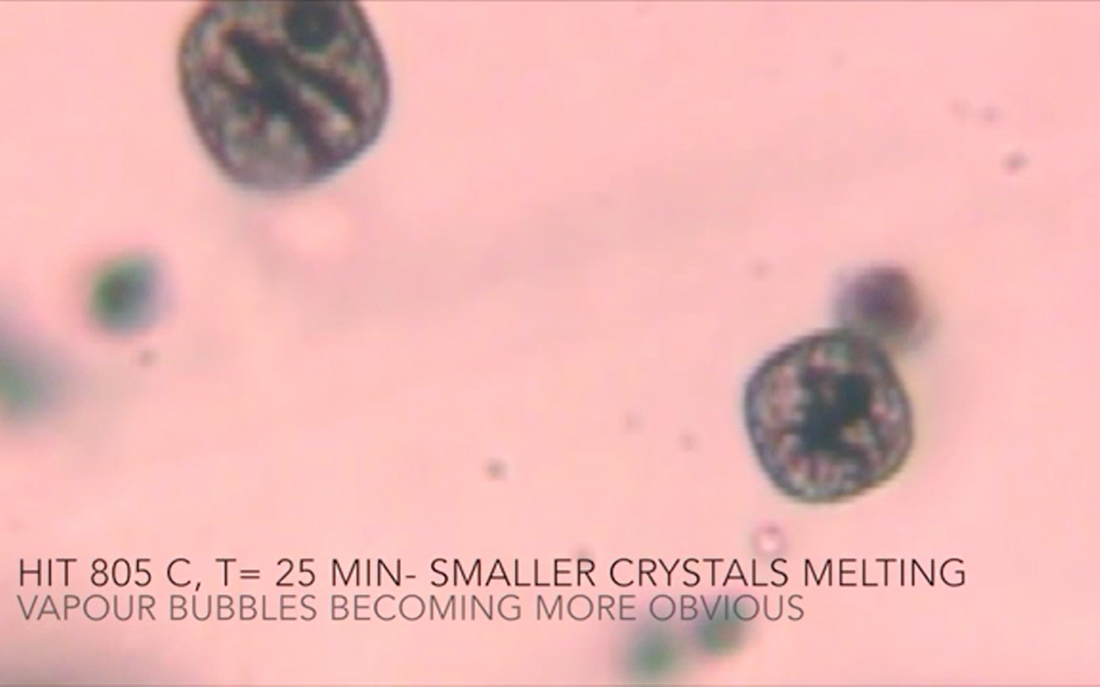
Fig. 6: Melt inclusions (the round circles in the above image) are little pockets of melt that are trapped in a growing phenocryst during crystallization. If erupted and cooled quickly, they preserve the composition of the melt in which their host crystal formed and for the most part, the original volatile concentration. However, slow cooling will cause these melt inclusions to form daughter crystals (shown as the dark grains in the round circles) which change the original melt composition. Vapor bubbles can also form during this slow cooling process (the dark circle inside of the melt inclusion) as CO2 and H2O exsolve from the melt, and thus change the entrapped volatile concentration.
|
These quartz crystals were taken from the upper portions of the Huckleberry Ridge Tuff fall deposit (2.1 Ma, 2,500km3), the oldest and largest of the three volcanic cycles that form the Yellowstone Volcanic Field. The bottom part of the deposit contains beautifully glassy, and bubble-free melt inclusions, however the upper portion had the unfortunate experience of being reheated after emplacement when the larger, and much hotter, ignimbrite was deposited. In order to restore the pre-eruptive melt composition, I reheated these quartz-hosted crystallized melt inclusions (diameter=50 micrometers) at the USGS in Menlo Park, using a reheating stage and the assistance of Dr. Jake Lowenstern.
Overall, I reheated 10 quartz grains (each takes 1-2 hours, with the process violently halted if the quartz grain explodes due to its initial experience at the alpha/beta transition) and videoed the process. The videos can be downloaded using the links below. Enjoy... Video 1: Large inclusion with a persistent vapor bubble that goes through the alpha beta transition. Video 2: Two inclusions homogenize to completion, with a snazzy soundtrack to lead the way. |
